

The midterm elections are on Tuesday, November 3, and the question I hear most this time of year is whether to do anything about them. Midterms come with plenty of noise: ads, polls, predictions about which side wins and what it means for your money. The market does tend to get choppy in a midterm year. What usually matters more is what happens after the votes are counted.
To keep this grounded in data rather than headlines, I went back through the last six midterms, from 2002 to 2022, and looked at four of the most widely followed index ETFs: SPY (S&P 500), IWM (Russell 2000 small caps), QQQ (Nasdaq-100) and DIA (Dow Jones Industrial Average). Here is what they did in the months around each Election Day.
The short version
- Midterm years are often bumpy. SPY’s largest peak-to-trough drop between January 1 and Election Day averaged about 17% across the last six midterm years.
- The year after has been better. SPY was higher 12 months after all six of those Election Days, with an average gain of about 9%.
- Not every index followed the script. Small caps (IWM) were lower a year after the 2022 midterm, and the averages lean heavily on strong rebounds after 2002 and 2022.
- Six elections is a small sample. This is a pattern worth knowing, not a timing signal.
How the market moved around the last six midterms
The chart below indexes SPY to 100 on each Election Day, so you can see every midterm on the same scale: six months before the vote on the left, a year after on the right. A line above 100 on the right side means SPY was higher than it was on Election Day.
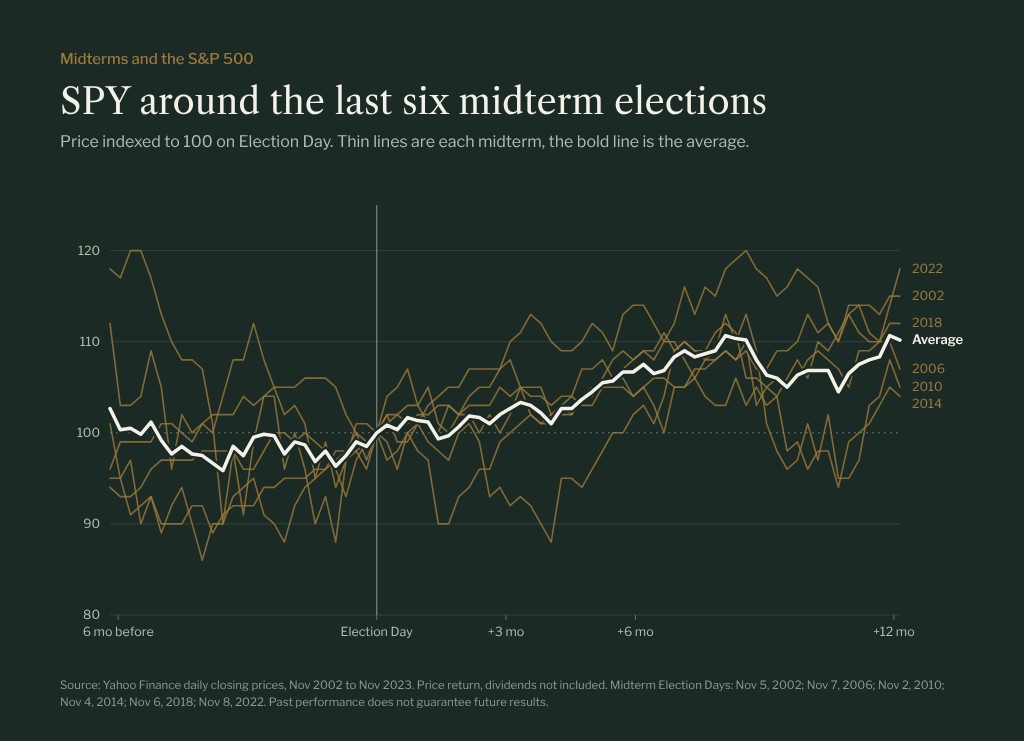
Before the vote, the paths are all over the place. In 2002, SPY was still sliding through the end of a bear market. In 2006 and 2014, it drifted higher into the election. After the vote, the lines start to fan upward, and the average climbs steadily through the following year.
The same view across all four ETFs shows a similar shape, with different personalities. The Nasdaq-100 had the biggest rebounds, the Dow the steadiest path, and small caps the widest range of outcomes.
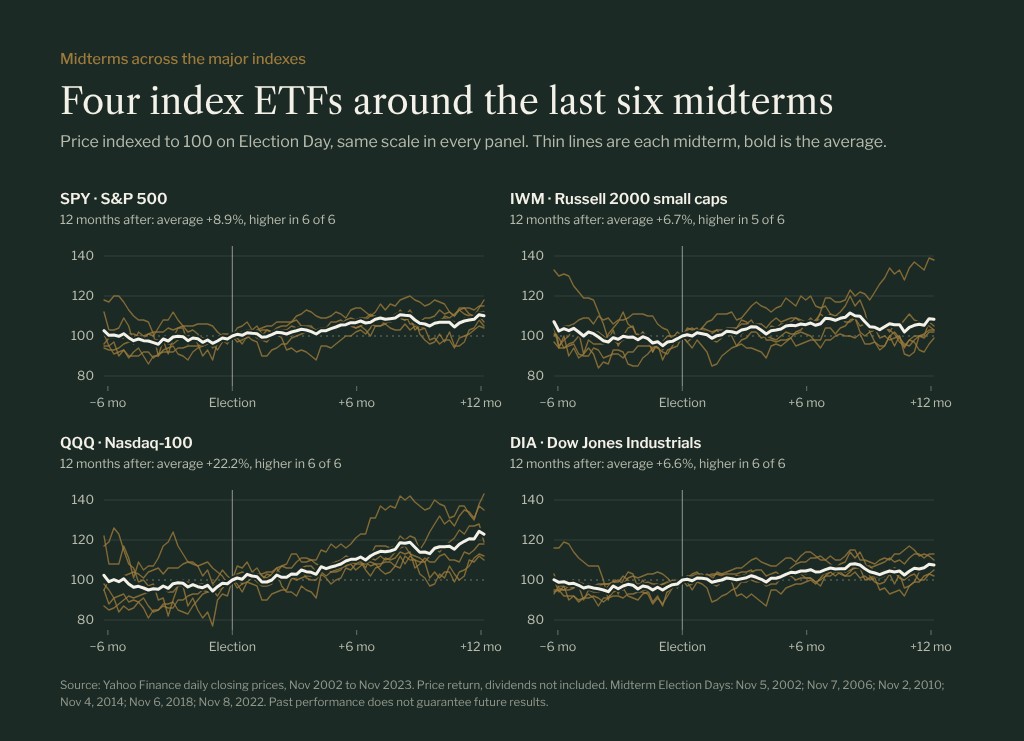
Here are the numbers behind those charts: the price change in the 12 months (252 trading days) after each Election Day.
| Midterm | SPY | IWM | QQQ | DIA |
|---|---|---|---|---|
| 2002 | +15.2% | +40.1% | +37.3% | +13.4% |
| 2006 | +6.2% | +2.0% | +20.8% | +9.0% |
| 2010 | +2.1% | +0.2% | +6.9% | +4.0% |
| 2014 | +4.6% | +2.1% | +13.5% | +3.0% |
| 2018 | +12.0% | +2.6% | +17.7% | +8.1% |
| 2022 | +13.6% | -6.9% | +37.3% | +2.2% |
| Average | +8.9% | +6.7% | +22.2% | +6.6% |
| Higher after 12 months | 6 of 6 | 5 of 6 | 6 of 6 | 6 of 6 |
The midterm-year drop
The more consistent part of the pattern happens before the election. In every one of the last six midterm years, SPY had a meaningful pullback at some point between January and Election Day. Some were mild, like the roughly 8% dips in 2006 and 2014. Others were deep: about 34% in 2002 and 25% in 2022, both years when a bear market and the midterm calendar overlapped.
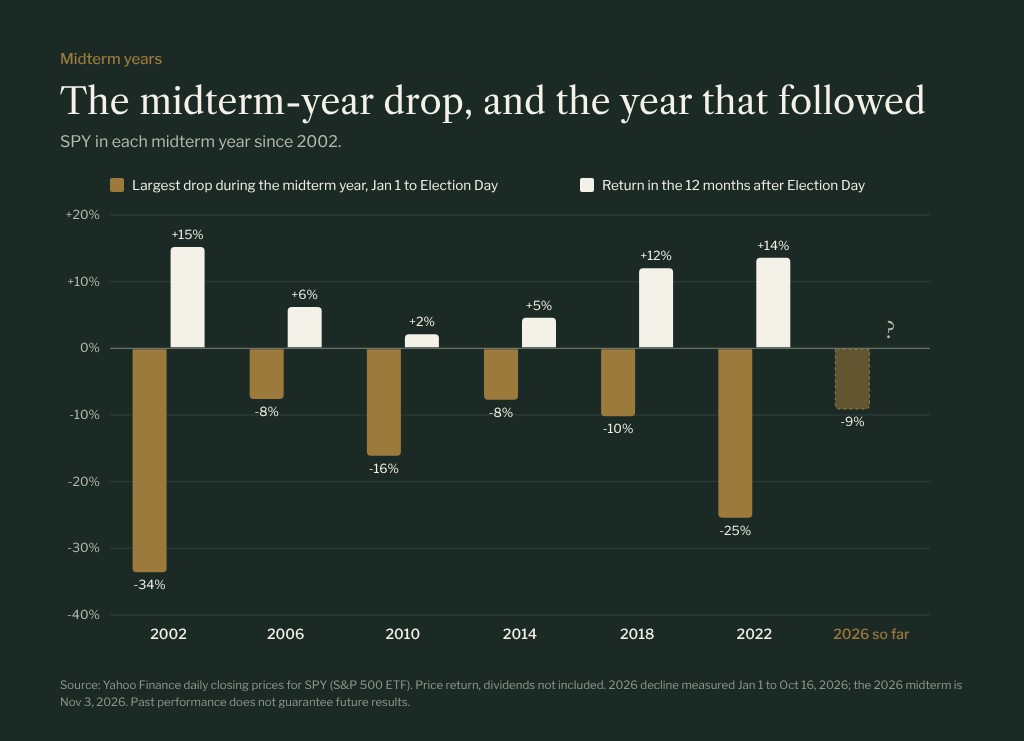
This fits a broader pattern that longer-term studies have found. An analysis published by LPL Research, using S&P 500 price returns from 1931 through 2025, found that midterm years averaged roughly five percentage points less than the other years of a presidential term, and described the year after midterms as one of the strongest periods for stocks (LPL Research).
So far, 2026 has looked a lot like a typical midterm year. As of the close on October 16, SPY was up about 12% for the year after a drop of about 9% between late January and the end of March. Small caps have had a rougher fall: IWM closed October 16 about 11% below its August 14 high.
Why markets tend to settle after the vote
There is no single reason, and anyone who tells you otherwise is guessing. A few explanations come up again and again:
- Uncertainty goes away. Markets dislike not knowing more than they dislike most outcomes. Once the results are in, investors can price what they know instead of what they fear.
- Divided government often means fewer big changes. Midterms frequently shift control of at least one chamber of Congress. Gridlock makes sweeping legislation less likely, and some investors read that as stability.
- Policy shows up with a lag. Election night itself rarely changes much for a company’s earnings. The legislation that follows over the next three, six, nine and 12 months is what can actually move the capital markets, and that plays out over time, not in a single session.
It is also worth noting what the data does not show. Across these six midterms, control of Congress shifted toward Republicans in some years (2002, 2010, 2014, 2022) and toward Democrats in others (2006, 2018). SPY was higher a year later in every one of them. The pattern has had more to do with the calendar and the economy than with which side won.
What history can’t tell you
A pattern built on six elections deserves some humility:
- The sample is small. Six data points can be swayed by one or two unusual years. The 12-month averages for IWM and QQQ lean heavily on the rebounds after 2002 and 2022, which both followed bear markets.
- It has failed before. IWM was down about 7% a year after the 2022 midterm, and SPY fell about 8% in the three months after the 2002 vote before recovering.
- Other forces are bigger. Interest rates, inflation, earnings and valuations usually matter more to markets than the election calendar. A midterm doesn’t cancel out a recession or a rate shock.
What this means for a long-term portfolio
For most families, the practical takeaway is to plan for some volatility around the election and avoid making big decisions because of it. Selling ahead of a midterm and waiting for the dust to settle means making two correct calls: when to get out and when to get back in. Historically, the period right after the vote has been a poor time to be sitting on the sidelines.
A few things are worth doing in any election year:
- Know your cash needs. Money you’ll need in the next year or two shouldn’t depend on how the market reacts to an election.
- Use pullbacks on purpose. Rebalancing back to your target mix during a dip is a disciplined way to put volatility to work.
- Separate the headlines from the plan. If a political outcome would genuinely change your situation, such as a tax change that affects a business sale or an estate plan, plan for that specific issue rather than reacting to the market’s mood.
If you’d like a second set of eyes on how your portfolio is positioned heading into November, you can start a conversation.
Common questions
Does the stock market usually go down before midterm elections?
Not always, but midterm years have often included a meaningful pullback. SPY’s largest drop between January 1 and Election Day ranged from about 8% to about 34% across the last six midterm years, and averaged about 17%.
How did stocks do after the last midterm elections?
SPY was higher 12 months after each of the last six midterm Election Days, by between about 2% and 15%. The Nasdaq-100 (QQQ) and the Dow (DIA) were also higher a year later every time. Small caps (IWM) were higher in five of the six.
Does it matter which party wins the midterms?
In the six midterms covered here, the shifts went both ways, and SPY was higher a year later after all of them. That doesn’t mean policy never matters. It means the election outcome alone hasn’t been a reliable guide to where the market goes next.
Should I sell before the election and buy back after?
That approach requires getting the timing right twice, and the strongest stretch in this data came after Election Day. If an election makes you uneasy about your mix of stocks and bonds, that is usually a sign the mix needs a review, not a reason to move to cash for a few weeks.
Why use ETFs instead of the indexes?
SPY, IWM, QQQ and DIA track the S&P 500, Russell 2000, Nasdaq-100 and Dow Jones Industrial Average, and they are what many investors actually hold. They also have daily price history going back to before 2002, so they cover the last six midterms. Figures are price returns and don’t include dividends.
This article is for general educational purposes and is not individualized investment, tax, or legal advice. Any ETFs mentioned are used to represent their indexes and are not recommendations to buy, hold, or sell any security. Reese Legacy Capital and its clients may hold positions in securities mentioned. Figures are price returns based on daily closing prices from Yahoo Finance for SPY, IWM, QQQ and DIA, do not include dividends, fees, or taxes, and are not the results of any Reese Legacy Capital account. Investing involves risk, including the possible loss of principal. Past performance does not guarantee future results. Reese Legacy Capital is a registered investment adviser in the Commonwealth of Pennsylvania. Registration does not imply a certain level of skill or training. For a full description of services, fees, conflicts, and risks, request Form ADV Part 2A.

Robert Reese
Founder of Reese Legacy Capital, a fee-only fiduciary adviser in Lancaster County, PA. About Robert
Portfolio management
Questions about your own portfolio?
A direct conversation with the person who would manage it: where you are, what you hold, and whether our approach makes sense for you.