
When oil jumps, the first question I hear is whether stocks are next. History gives a more useful answer than yes or no. I looked at four of the biggest oil shocks since 1970, and at what the S&P 500 and the 10-year Treasury yield did while oil climbed. I also walk through it in the video below.
The short version
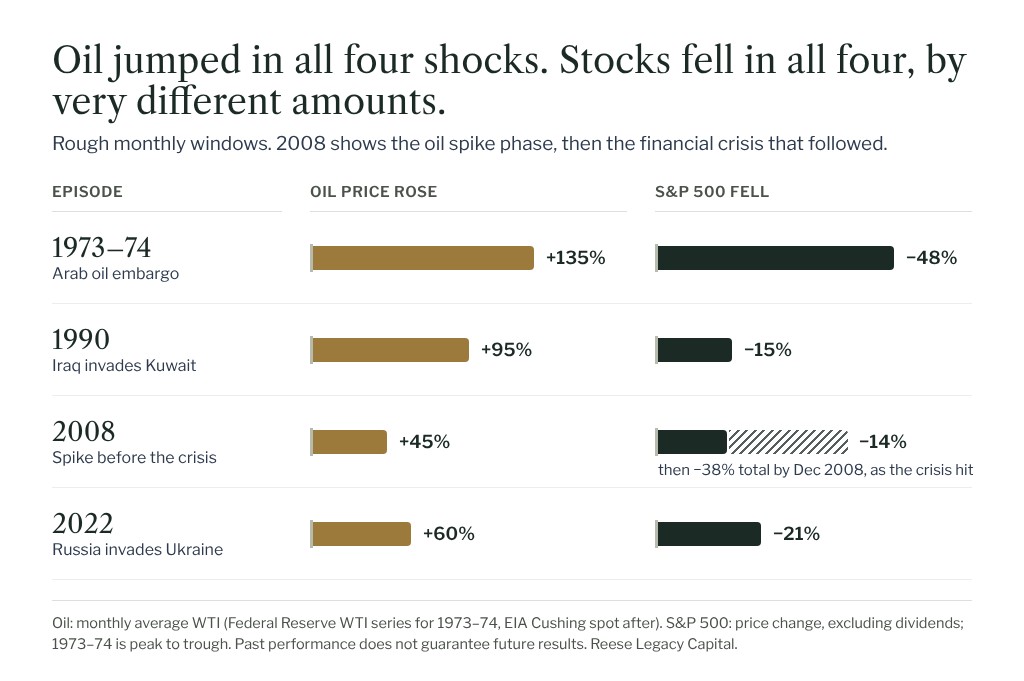
- Stocks fell during all four oil shocks, but for different reasons and by very different amounts. The declines ranged from about 14% to about 48%.
- Why oil is rising matters more than how much it rises. Economists separate spikes caused by supply disruptions from spikes caused by strong global demand, and stocks tend to react to them differently.
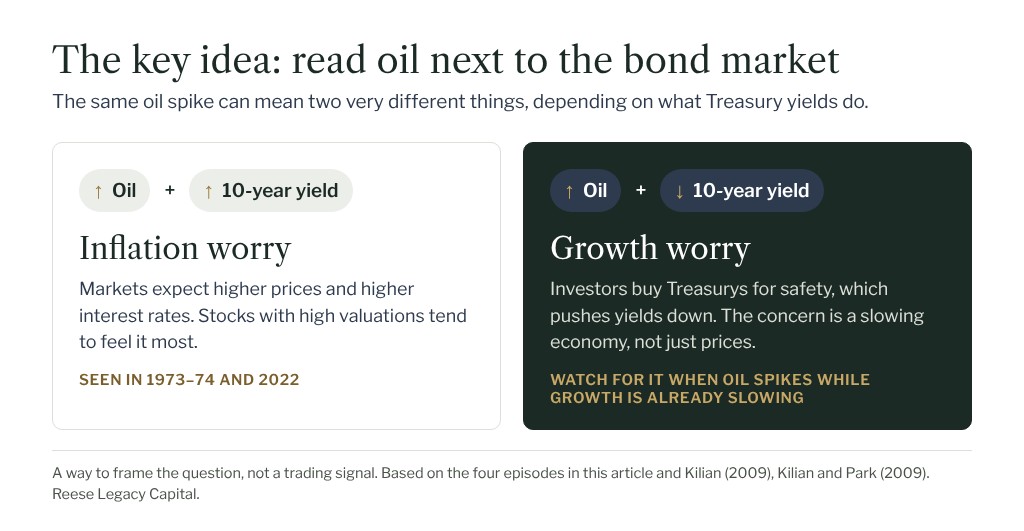
- The 10-year Treasury yield is one of the most useful things to watch next to oil. Oil and yields rising together points to inflation worries. Oil rising while yields fall points to growth worries.
- None of this is a signal to buy or sell. Four episodes is a small sample, and each one came with other things going on in the economy.
Four oil shocks, side by side
| Episode | Oil (monthly WTI) | S&P 500 | 10-year Treasury yield | What else was going on |
|---|---|---|---|---|
| 1973–74 Arab oil embargo |
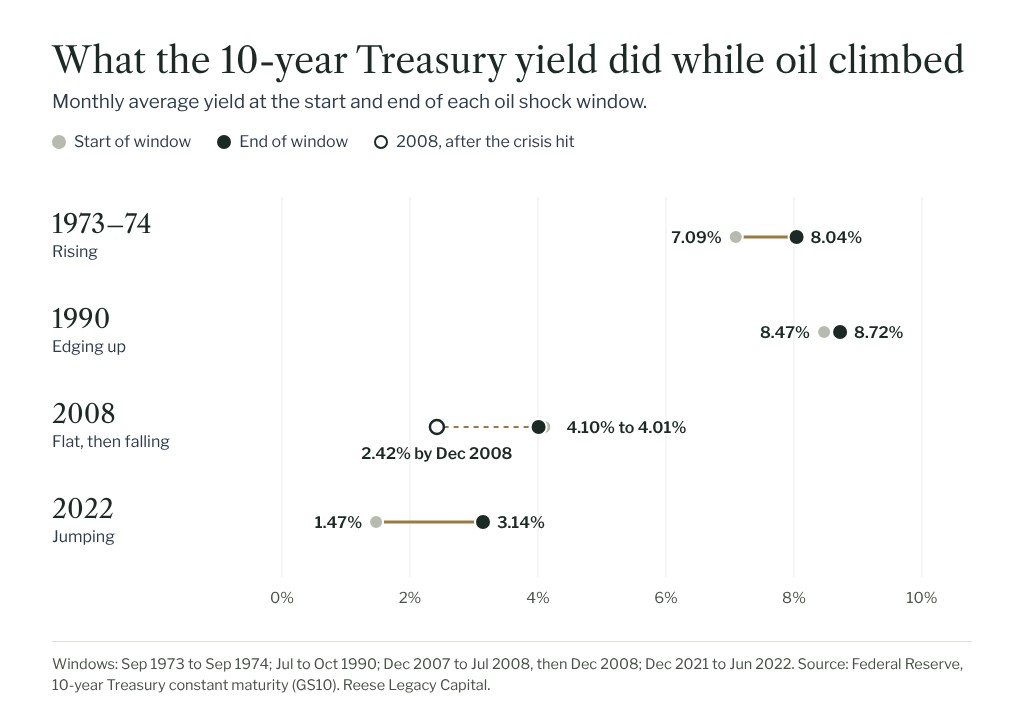
$4.31 (Sep 1973) to $10.11 (Jan 1974), up about 135% | Down about 48%, from the Jan 11, 1973 high to the Oct 3, 1974 low | 7.09% (Sep 1973) to 8.04% (Sep 1974), rising | Inflation was already high |
| 1990 Iraq invades Kuwait |
$18.45 (Jul) to $36.04 (Oct), up about 95% | Down about 15%, from the July 31 close to the October 31 close | 8.47% (Jul) to 8.72% (Oct), edging up | The economy slipped into recession |
| 2008 The spike, then the crisis |
$91.69 (Dec 2007) to $133.37 (Jul 2008), up about 45% | Down about 14% from Dec 31, 2007 to July 31, 2008, then about 29% more by Dec 31, 2008 | 4.10% to 4.01%, roughly flat, then 2.42% by December | A financial crisis followed, and oil collapsed |
| 2022 Russia invades Ukraine |
$71.71 (Dec 2021) to $114.84 (Jun 2022), up about 60% | Down about 21%, from Dec 31, 2021 to June 30, 2022 | 1.47% (Dec 2021) to 3.14% (Jun 2022), jumping | Inflation surged and the Fed raised rates quickly |
These are rough monthly windows, not exact peaks and troughs. Oil prices are monthly averages: the 1973–74 figures are the Federal Reserve’s WTI series, and the later figures are the EIA’s Cushing, Oklahoma WTI spot price. Yields are the Federal Reserve’s monthly 10-year averages. S&P 500 figures are price changes that leave out dividends, based on closing levels of 1,468.36 at the end of 2007, 1,267.38 on July 31, 2008, 903.25 at the end of 2008, 4,766.18 at the end of 2021 and about 3,785 on June 30, 2022, and on the 1990 month-end closes of 356.15 and 304.00. The 1973–74 decline is from the S&P 500’s peak-to-trough record. Past performance does not guarantee future results.
What happened in each one
1973–74: the Arab oil embargo. Oil more than doubled in a few months, on top of inflation that was already running high. Yields rose, and stocks went through one of the worst bear markets since World War II, falling about 48% from peak to trough. This is the episode most people picture when they hear “oil shock.”
1990: Iraq invades Kuwait. Oil nearly doubled between July and October. The S&P 500 fell about 15% over the same stretch while yields edged higher, and the economy slipped into a recession. Once the spike faded, so did much of the pressure on stocks.
2008: the spike, then the crisis. This is the one people tend to misremember. Oil rose about 45% from December 2007 to July 2008, and stocks fell about 14% while yields stayed roughly flat. What came next was not an oil story. It was a financial crisis. Oil collapsed, stocks fell about 29% more by year-end, and the 10-year yield dropped to about 2.4%. Falling yields there were a sign of fear, not relief.
2022: Russia invades Ukraine. Oil rose about 60% from December 2021 to June 2022, and the S&P 500 fell about 21%. This time yields more than doubled as inflation surged and the Federal Reserve raised rates aggressively. Stocks with high valuations were hit hardest.
Not all oil shocks are alike
Economist Lutz Kilian made this point in a well-known 2009 paper, “Not All Oil Price Shocks Are Alike.” He separated oil price increases driven by supply disruptions from increases driven by strong global demand, and by worry about future supply.
In follow-up research with Cheolbeom Park, Kilian found that U.S. stocks respond very differently depending on which kind of shock is behind the move. A demand-driven spike can arrive alongside rising stock prices, because the same strong economy is lifting both. Spikes driven by supply disruptions or by precautionary buying tend to weigh on stocks.
That is why “oil is up 30%” on its own tells you less than it seems. The more useful question is why it is up.
The key idea: watch yields
The oil price alone doesn’t tell you much. What the bond market does alongside it tells you a lot more.
- Oil and yields rising together, as in the 1970s and 2022, usually means the market is worried about inflation. That tends to mean higher interest rates, and higher rates hit stocks with high valuations hardest, because more of their value sits far in the future.
- Oil rising while yields fall usually means the market is worried about growth. Investors are buying Treasurys for safety. That is a different setup, and it calls for different questions about the economy.
Sectors feel it differently
An oil spike doesn’t hit every company the same way. Energy producers’ revenue tends to rise with the price of oil. Airlines, trucking companies and consumer businesses either pay more for fuel themselves or watch their customers spend more of their budgets on it. I’m describing how the costs flow through the economy, not suggesting what anyone should own.
What this doesn’t mean
It isn’t a signal to buy, and it isn’t a signal to sell. Four episodes isn’t a law of physics. In 1990 and 2008 there were recessions, and in 2008 a banking crisis, so oil was never the only thing moving markets. The economy has also changed a great deal since the 1970s, so history rhymes more than it repeats.
What this means for your portfolio
When oil spikes, the most useful things you can do are usually the least dramatic. Know how much of your portfolio leans on companies that are sensitive to fuel costs or to interest rates. Make sure the cash you will need in the next few years isn’t riding on the stock market. And avoid making a big change because of a single headline.
If you’d like someone watching these moving parts with you, that’s the work I do for families every day. Start a conversation.
Common questions
Do stocks always fall when oil prices spike?
In the four big oil shocks I looked at, the S&P 500 fell each time, by roughly 14% to 48%. But research shows the reaction depends on the cause. Spikes driven by strong global demand have sometimes come alongside rising stock prices.
Which oil shock hurt stocks the most?
Of these four, 1973–74. The S&P 500 fell about 48% from its January 1973 high to its October 1974 low, with oil more than doubling and inflation already high.
Why do Treasury yields matter when oil rises?
They show what the bond market is worried about. Oil and yields rising together suggests inflation concerns and higher rates. Oil rising while yields fall suggests concern about economic growth.
Do energy stocks go up when oil spikes?
Energy producers’ revenue tends to rise with oil prices, but stock prices depend on many other things, including how long the spike lasts. This is a description of how costs flow through, not a recommendation.
Should I sell stocks when oil spikes?
History doesn’t support a simple rule. The right move depends on your goals, your timeline and how your portfolio is built, which is why it helps to talk it through before acting on a headline.
This article is for general educational purposes and is not individualized investment, tax, or legal advice or a recommendation to buy or sell any security. Investing involves risk, including the possible loss of principal. Past performance does not guarantee future results. Figures are based on the sources linked above and may be revised. Robert Reese and clients of Reese Legacy Capital may hold positions in securities discussed, including energy stocks. Reese Legacy Capital is a registered investment adviser in the Commonwealth of Pennsylvania. Registration does not imply a certain level of skill or training. For a full description of services, fees, conflicts, and risks, request Form ADV Part 2A.

Robert Reese
Founder of Reese Legacy Capital, a fee-only fiduciary adviser in Lancaster County, PA. About Robert
Portfolio management
Questions about your own portfolio?
A direct conversation with the person who would manage it: where you are, what you hold, and whether our approach makes sense for you.